Brexit Votes
brexit <- read_csv(here::here('data', 'brexit_results.csv'))
glimpse(brexit) #exporing the brexit data frame
#converting the table to a longer format so as to male a scatter plot with a trend line for each of the patrties
plot <- brexit %>%
pivot_longer(cols=2:5, names_to='party_name', values_to='party_pct') %>%
ggplot(aes(x=party_pct, y=leave_share, colour=party_name)) +
theme_bw() +
geom_point(alpha=0.25) +
geom_smooth(method='lm', size=0.5) +
#adding a different colour to the trend lines and points of each party
scale_colour_manual(
labels = c('Conservative', 'Labour', 'Lib Dems', 'UKIP'),
values=c('#0087dc', '#d50000', '#fdbb30', '#efe600')) +
#Position he legend at the bottom
theme(legend.position='bottom', legend.title=element_blank()) +
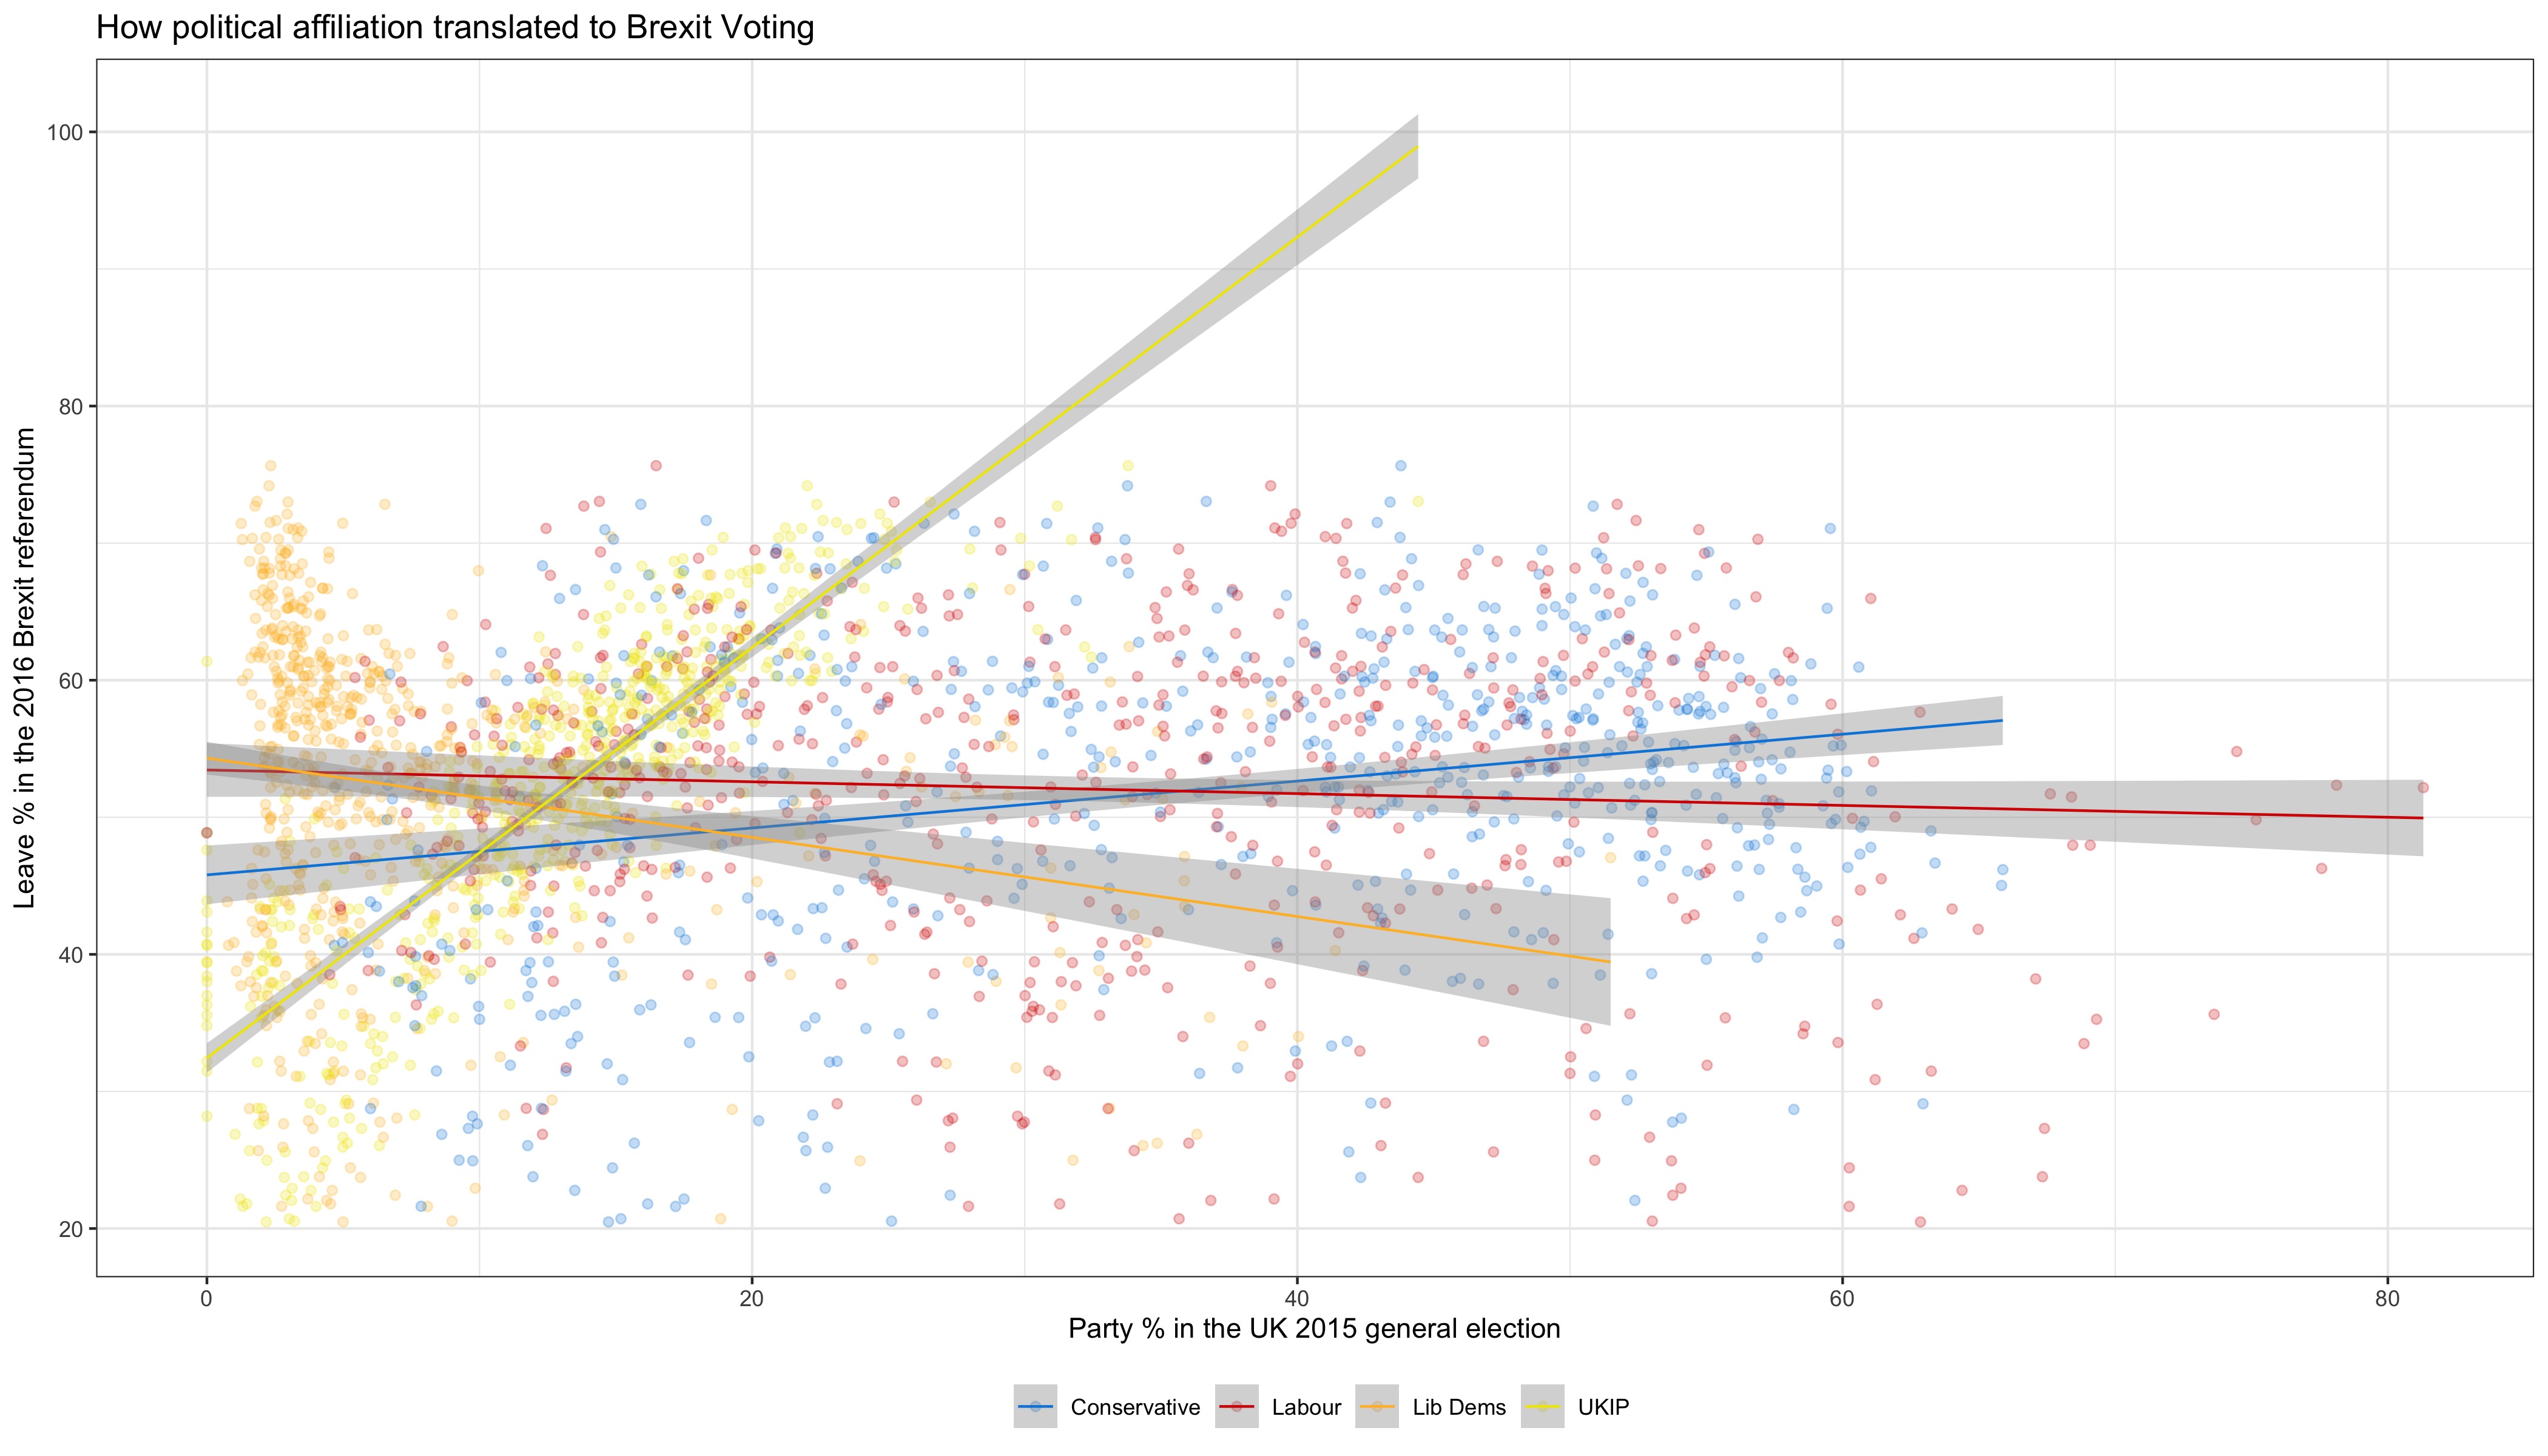
labs (
title = "How political affiliation translated to Brexit Voting",
x = "Party % in the UK 2015 general election",
y = "Leave % in the 2016 Brexit referendum") +
NULL