Course Evaluation Dashboards
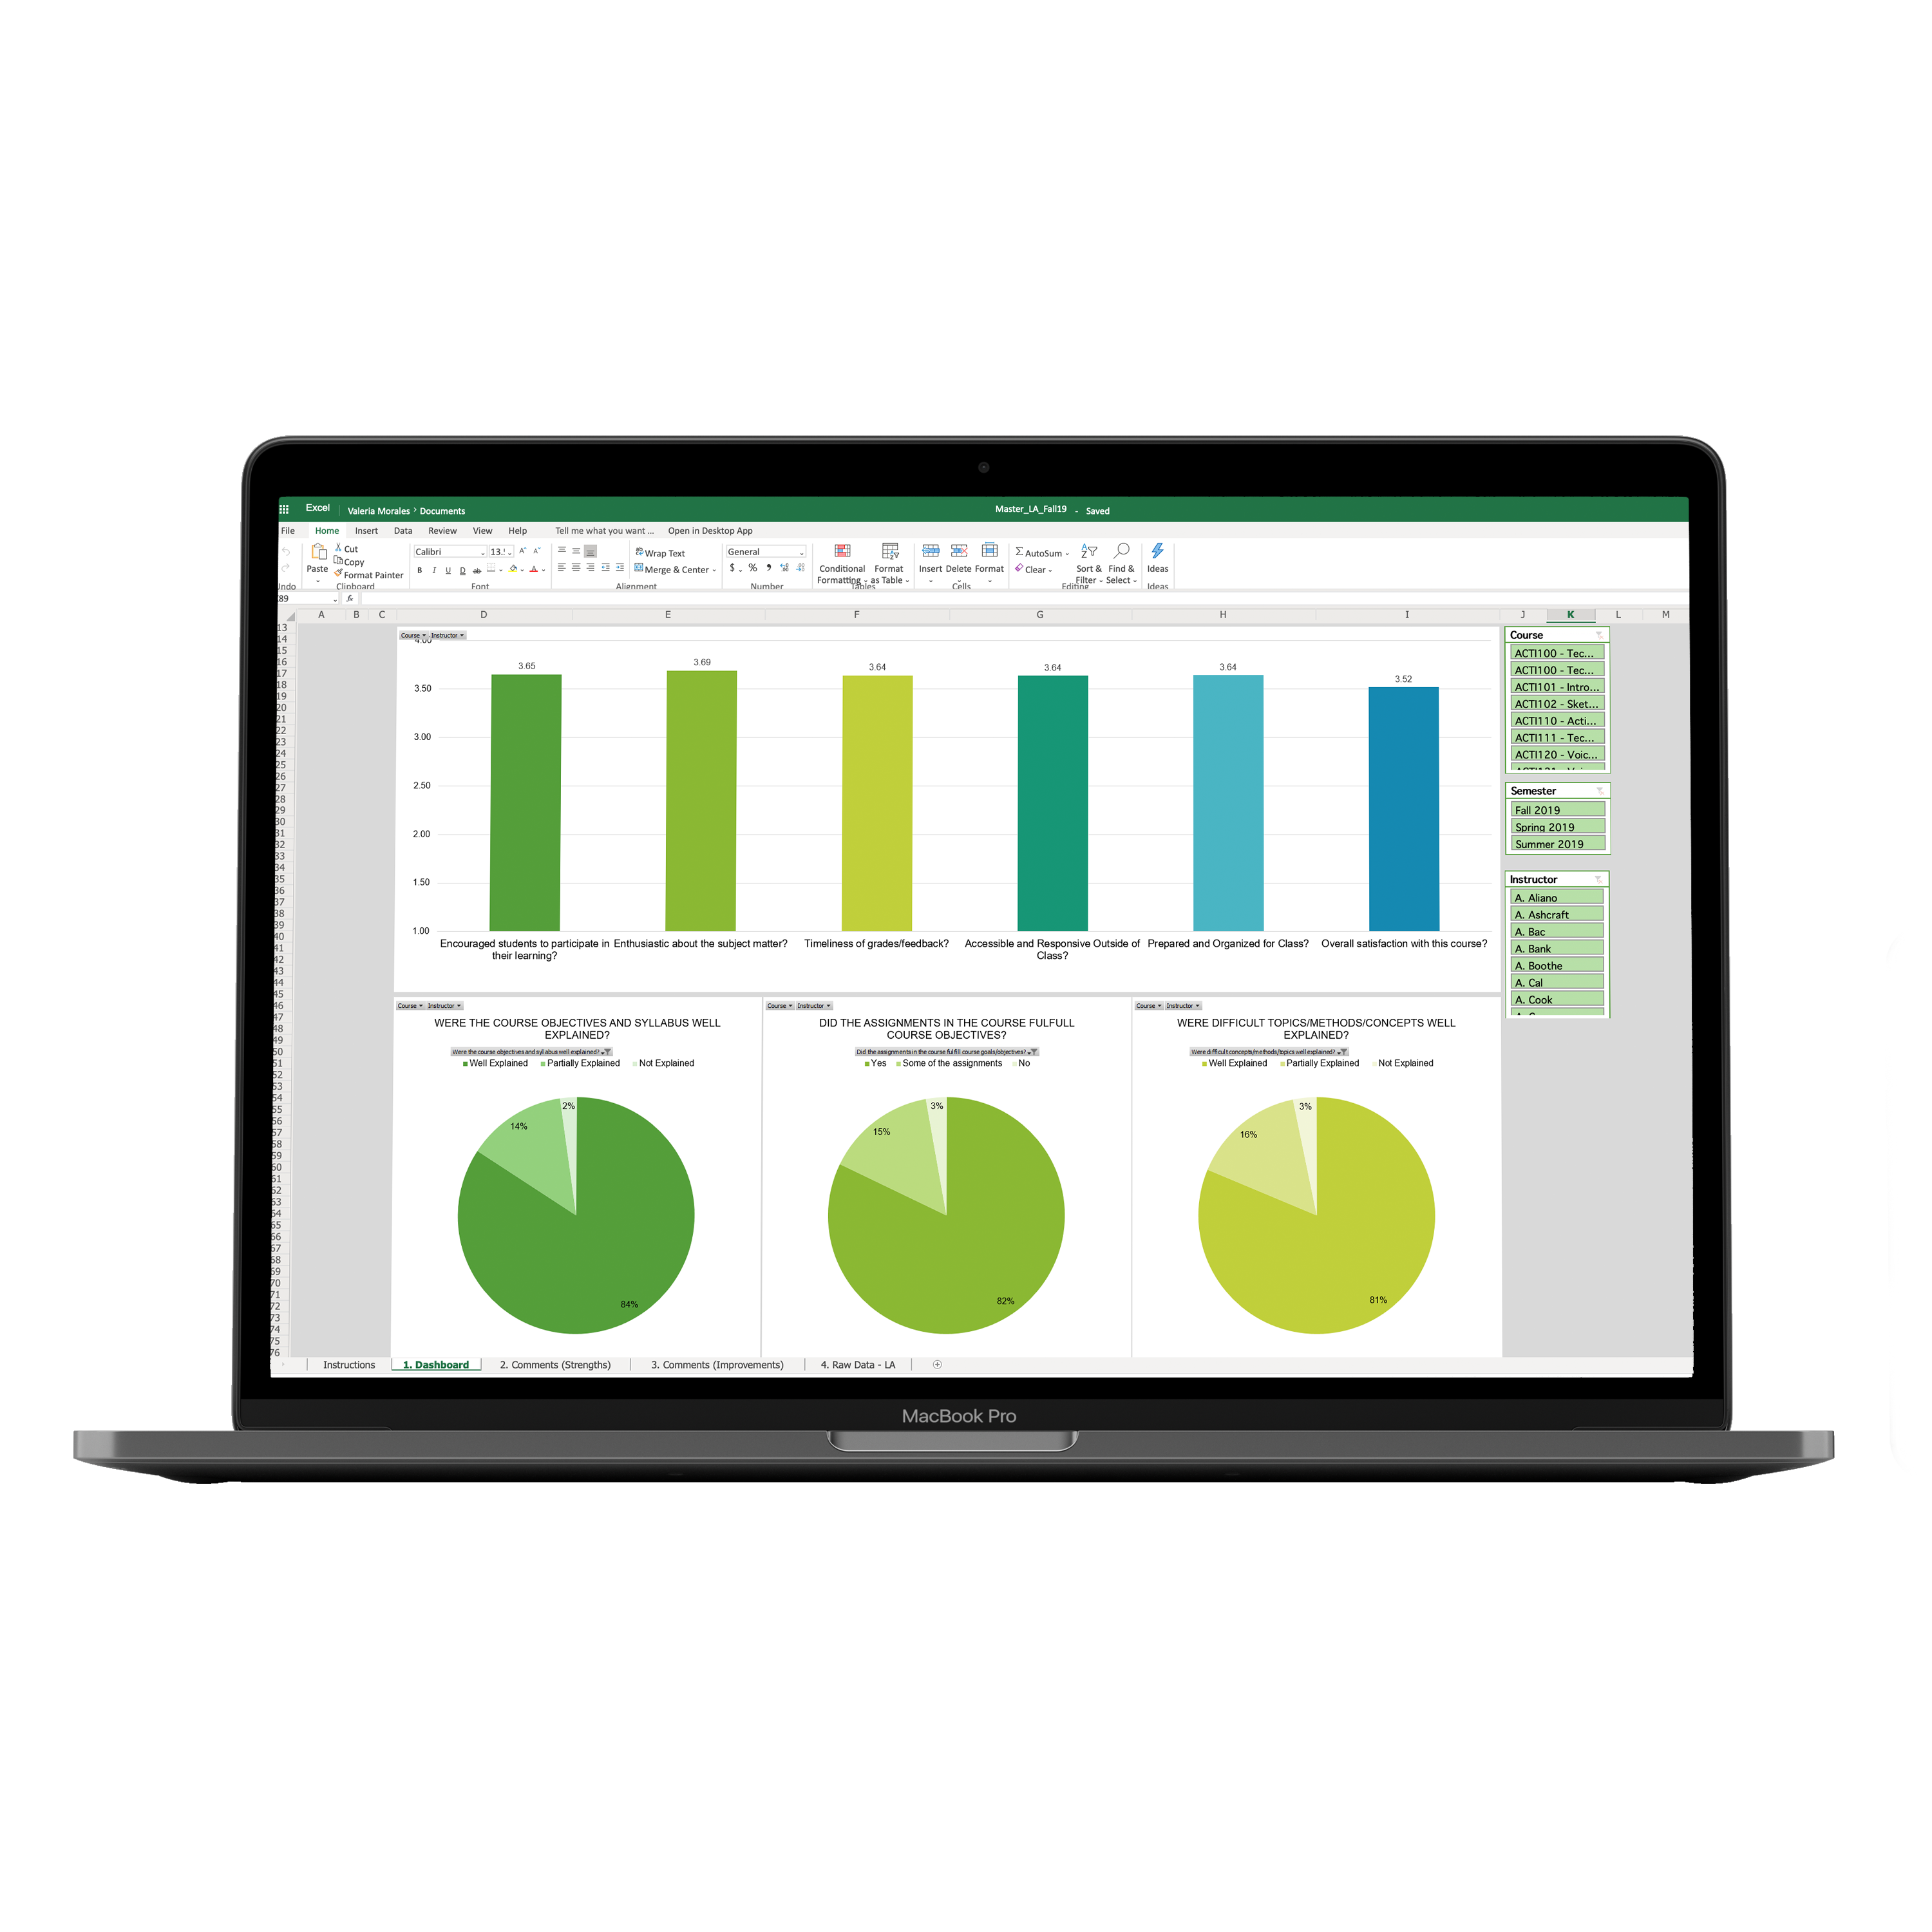
I was given the task to update course evaluations from paper-based to web-based in order to increase efficiency and improve department management. I utilized Excel Pivot Tables to create the first data dashboards at NYFA. The dashboards are user friendly and interactive as they can be filtered by semester, course, and professor.
I presented the dashboards to the Department Chairs at the Los Angeles campus and taught them how to the dashboards can be used to develop insight about their department. For the first time in NYFA history, Department Chairs are able to see aggregate performance data that directly supports their business decisions.
 The dashboards shortened the time of evaluation dissemination from 3 months to 1 week, reduced $45000 a year in costs, and have become the leading evidence in personnel management across an entire academy.
The Vice President of Institutional Research submitted the dashboards to the Association of Institutional Research (AIR) Conference 2020. We were accepted as speakers for the one of the largest sessions offered and submitted a video in May 2020 for an on-demand session titled “Interactive Course Evaluation Dashboards for Department Management.”